This website is directed at the following kind of person:
If this sounds like you, you're in luck - this website was designed with people like you in mind! Statistics can be kind of intimidating at first, but hopefully this resource will make it a little bet less so.
We'll be using something called R to do the statistics for us. R is a free statistical programming language that has become increasingly popular in a variety of disciplines since it provides so many powerful tools for visualizing and analyzing quantitative data.
There's just one problem - R is still ultimately a programming language! This means that there is no user-friendly "point-and-click" interface. Instead, R operates entirely off of you typing up and running "scripts" - entirely from scratch mind you, based off of your knowledge of how the R programming language works. For many people, this is a new kind of way of thinking and interacting with a computer - plus it requires quite a bit of experience coding in R before you can do much at all. As a result, there is often a steep learning curve for people learning R for the first time.
This is where this website comes in. What I've done is create a suite of scripts for you! You'l find scripts for all the most common kinds of statistical tests - t-test, ANOVA, linear regression, etc. - most of the things you'll ever need to use in a write-up of your experiment. More importantly, though, inside each of these scripts there is extensive annotation at every step of the way. That is, you'll never be expected to just 'come up with' any code on the spot. The code you need to run is clearly marked as a sequence of numbered steps (#1, #2, #3, and so on) so you won't get lost.
The scripts will assume you are 100% new not only to R, but also to programming languages in general – which is probably the case for the majority of people who are reading this file. As such, time will be spent explaining even some very basic concepts that are crucial to understanding what's going on. If you already have some experience in programming, you can just skim through those sections.
In short, this website is geared towards letting you unlock the immense power of R for including statistics in your papers without getting drowned in the task of learning a programming language. So... what are you waiting for? Let's get started!
Note: This website was written using a Windows operating system. The details may vary slightly if you have a different operating system (e.g. Mac or Linux). Let me know if anything ends up being completely wrong because of operating-system mismatches!
The most common way of using R is by downloading the R program from the Internet, installing it, and running it just like any other program. So the first step will be for you to download R and get it set up on your computer.
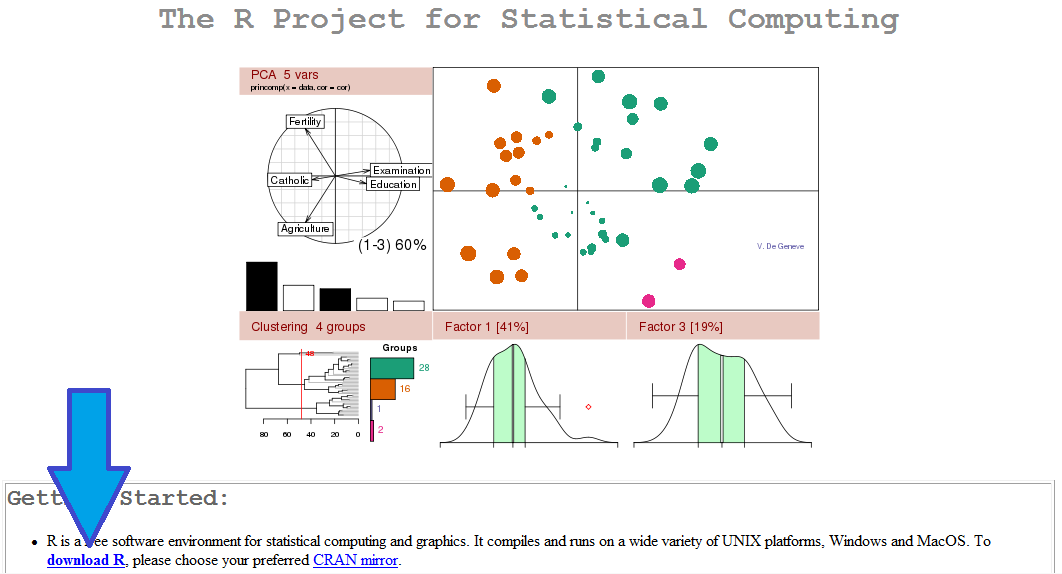
R can be downloaded from the official website of "the R Project for Statistical Computing", the organization that maintains and updates R. Their website is known as the "Comprehensive R Archive Network", or CRAN for short. The URL is http://www.r-project.org/. Under "Getting Started" on the main page, click on "download R":
People from all over the world download this software, and so in order to make sure your download isn't excessively slow from trying to download something from a server on the other side of the planet, on the next page you can choose approximately where you are. Since each of these sites carry the same files, they are referred to as 'mirror sites':
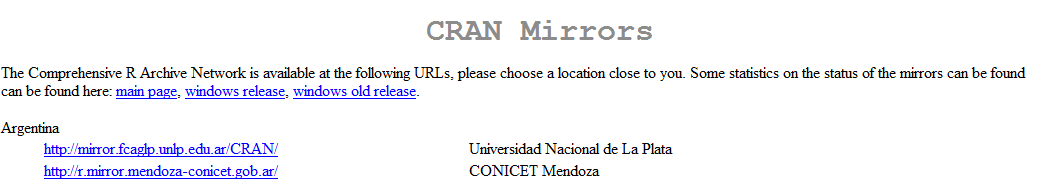
Scroll down and choose the closest one to where you currently are. For example, if you're in Indiana, USA, you might want to download from a server in St. Louis, Missouri (since it's only 4 and a half hours driving distance away). The differences in download speed between mirrors are often very slight, so you can generally just pick anywhere in or near the country you are currently in and you will be fine.
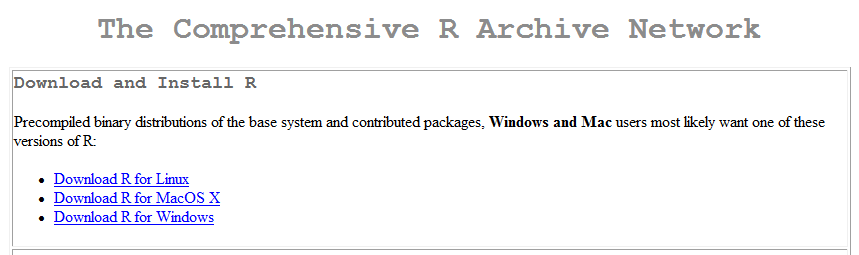
On the next page, select your operating system at the top under "Download and Install R":
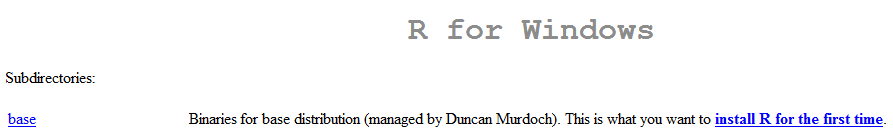
For Windows, next click either link where it says "base - Binaries for base distribution […] This is what you want to install R for the first time." then select "Download R 2.15.0 for Windows" and start up the download. (It shouldn't matter whether you have a 32-bit or 64-bit system.) If you run into any troubles, immediately below the "Download R 2.15.0 for Windows" link, there is a page called "Installation and other instructions" - try going there for help.
For Mac, select the PKG file that says "latest version", like this:
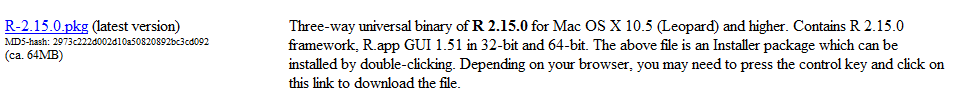
After this point, it's up to you! Follow the prompts, like normal, to install R on your computer.
R operates just like any other program on your computer. In Windows, once you install the program, it will put a folder in your 'Program Files' directory containing the different bits and pieces that make up R. You should never have to go into these files. As with all other programs you install on Windows, it will let you put an entry in your 'Program Files' section in the Start Menu as well as an icon on your desktop. These will take you directly to the "RGui.exe' program, which is the only file inside your R directory that you should ever have to worry about. Either via clicking on the desktop icon or navigating to the the Start Menu link, go and open R now.

Open R now, e.g. by clicking on the R icon on your desktop. When it pops open, it should look something like this:
(You'll notice I'm running a slightly outdated version of R, but that won't impact anything for our purposes.)
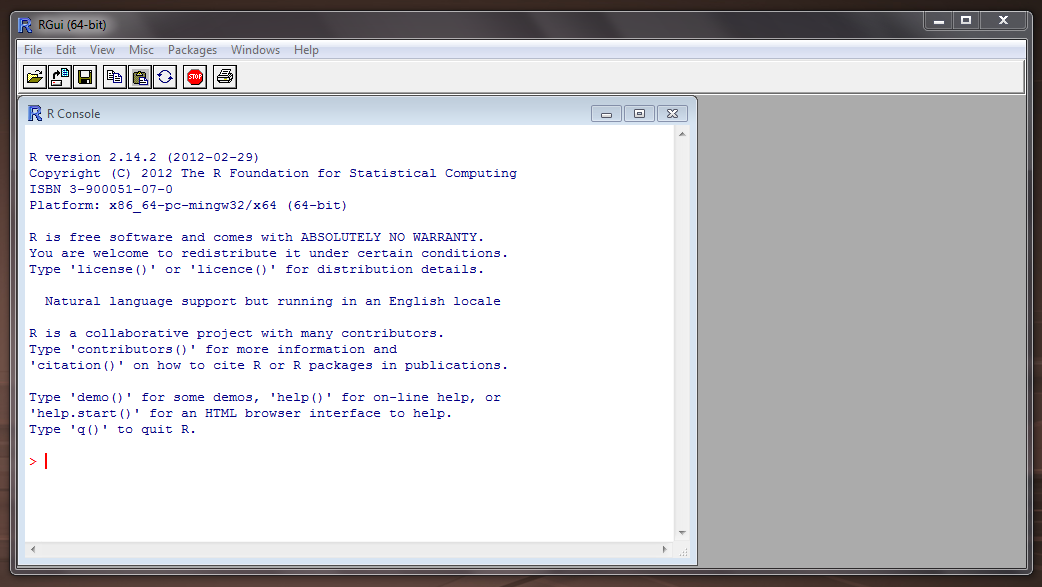
What you see open right now is known as the 'R console' (as the title of that window indicates). While it's possible to do everything in the console itself, when doing anything even remotely complicated, it's always better to open a separate 'Scrpting Window' for you to do all your work in.
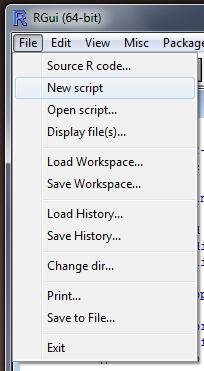
Let's do that now. Go up to 'File' and select 'New script':
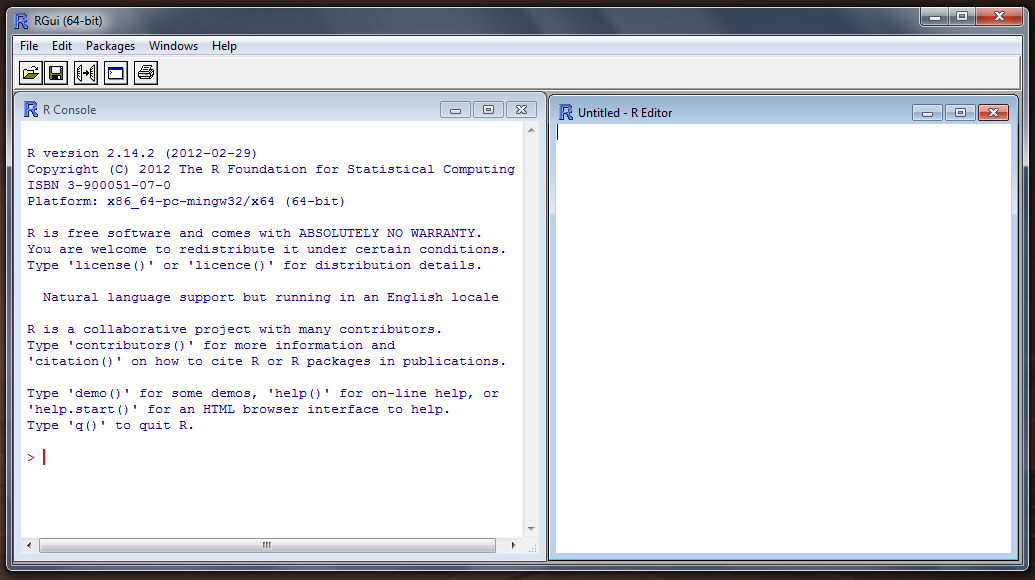
Resize the windows appropriately so you can see both the R Console and the Scripting Window. Now the R Window should look something like this:
As mentioned earlier, all the work in R is done through programming up scripts. A script is basically a series of commands that you 'pass' to R for it to execute one-by-one. It is as if you're telling R "Please do this thing", then "Next, please do that thing", and so on. Thus, for example, you'll run one command to tell R where your data is on your computer, another command to read in the data, another few to specify the parameters of a statistical test, one more to actually run the test itself, etc.
For example, let's use R like a calculator: try typing in 1+1 in the scripting window. All the commands you want to run will need to be typed inside this 'scripting window', which works like a text editor (think a stripped-down version of Microsoft Word.)
And... so what happens? R sits and happily does nothing at all! That's because R doesn't know what you're doing there until you 'run' that line of code to it, telling R to process it. To do this, just put your cursor on the line of code you want to 'run' and then hit CONTROL+R on your keyboard (COMMAND+R on a Mac). You will very quickly get used to hitting this key sequence, as it is a fundamental part of working in R.
You should now see the following display in the console:
> 1+1
[1] 2
The console is R's way of telling you what it's doing. These two lines that just appeared exemplify the two basic kinds of information that are represented in the console (which are conveniently color-coded to help you keep staight what's what).
The red-colored text beginning with a ">" sign is R's way of reminding you of the command you just told it. It might sound redundant, but this is in fact a very useful way to keep track of what you're doing. All the text that appears in the console stays there long after you've run the code, so this is like a semi-permanent record of your 'history' of what you've done. This can be useful if you mess up someplace - you can backtrack and see what you did wrong.
The blue-colored text following this is R showing you it's 'output', i.e. the result of its calculations. In this case, it tells you the answer is 2. (Big surprise!) The [1], called the 'index', just tells you it's the 1st component of the output. This is useful, for example, if you ask R to add +1 to twenty different numbers and you want to keep track of which is which (e.g. you want to know the result for the 19th number or something). For our purposes, you can generally ignore the index, though.
It would be possible in theory to execute entire scripts in one singlt very long and complicated command. But this is typically not how things are done. Normally, we do things in a step-by-step fashion and store the results at each step inside a 'variable'.
Let's give this a try. In the scripting window, go back to the start of the line that says '1+1' and add 'x=' there, thus yielding 'x=1+1'. Now put your cursor on that line and run the code (with CONTROL+R or COMMAND+R). You'll see that the R console now says:
> x=1+1
Hold on! Why is there no blue-colored text? The reason is that you technically haven't asked R for any output. All you did was tell R, "Please run this calculation (1+1) and then store the results inside a variable called 'x'. Think of a variable like a box - it stores something that you put inside of it. (That act of 'storing' is what the equals sign means here.) In order to get R to tell you what's inside this 'box', start a new line in the script and type just 'x' there. Now make sure you have your cursor on that line and run it with CONTROL+R or COMMAND+R and it will give you the following:
> x
[1] 2
Let's say you wanted to run both of these lines of code one after another. If you run the first line again, R is smart and advances your cursor to the second line after running the first, which means you can just keep hitting CONTROL+R or COMMAND+R over and over and run a whole script. However, if you run a lot of code, this could be tedious. Instead, you can also select/highlight a range of text and hit CONTROL+R or COMMAND+R. This will run all the code that you have selected. In theory, you could select all the text of an entire textfile and run it all at once, but typically it's smarter to go line-by-line so you know exactly what you're doing.
That's the basic mechanics of how R works. The beauty lies in how flexible it is. You can make up whatever wild and crazy variable name you want (with a few limitations) and store any calculation you want inside it. That is, something like this will work perfeclty well, too:
> ThisIsAReallyCoolVariableName = 1 + 9999 - 0.987654321 * 0.1 / 123
In case you're wondering, the '*' symbol is used for multiplication and the '/' symbol is used for division.
All right - you've got the basics down as far as how R works. Now it's time to get started with bringing your data into R. Ultimately, R will need to read in a textfile (of file extension '.txt'). By far, though, the easiest way to do this is to first organize it in a spreadsheet program like Microsoft Excel. You need to first get your data all cleaned up so it looks something like this:
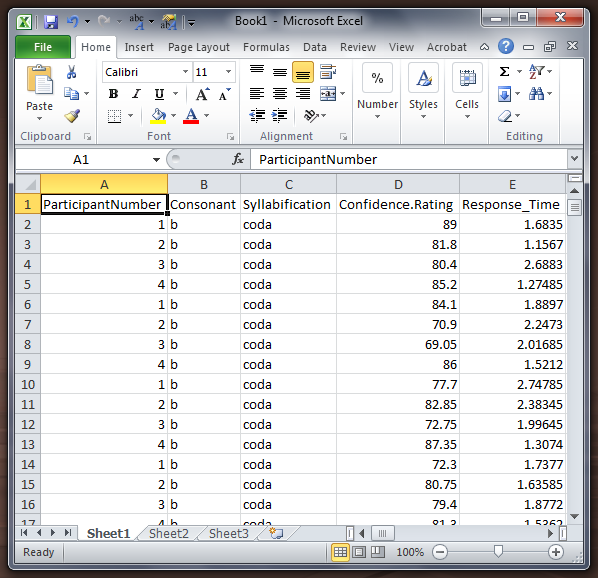
When importing data into R, you'll be grabbing one rectangular area from this spreadsheet. In doing so, it will make your life a lot easier if you don't have any missing cells in this range of cells. (It helps R out a lot if every row has the same number of columns.) In order to make sure this is the case, if you happen to have any missing values, fill them with the word 'NA' (without single quotes). This is an abbreviation for 'Not Available' and is R's formal symbol for missing data.
You'll also need to give each of your columns a 'column name'. This needs to be the first row of the range in Excel. Unlike SPSS, you can basically make the column names as long and descriptive as you want. It is, however, recommended you keep them fairly short (so you don't make typos when referring to them later on the line) and use only letters and number (i.e. no symbols like '-' or '/'). Also, crazy as it sounds, it's a good habit to not us spaces in column names. Instead, you have three alternatives.
Unlike most other symbols, a period and an underscore will not cause problems if used in column names.
One final thing - each column should have either all numbers or all text (excluding the column names). In other words, there should generally not be any mixing of the two inside a column. This is because R assumes each column will have only one or the other type.
Since it is much easier to bring data into R if the data is stored as plain text, the next step is to create a textfile that to store all of your data. There are two ways of doing so.
One option is to open a text editor program like Notepad / Notepad++ (Windows), or Text Wrangler (Mac):
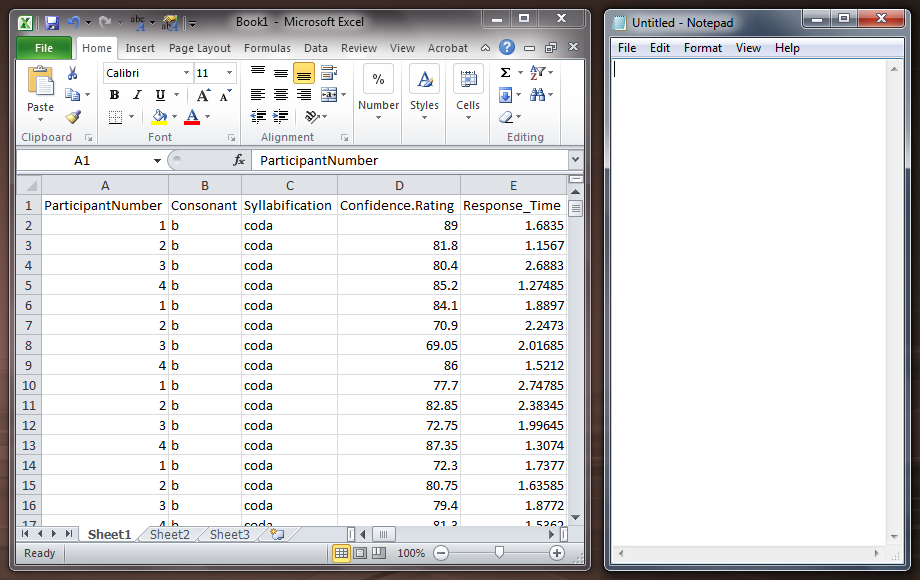
Now select the range of cells in Excel that you want to import and 'copy' them to your clipboard (e.g. by hitting CONTROL+V (or COMMAND+V on a Mac). Next, click inside the window of the text editor and 'paste' the contents of your clipboard there. It should then look something like this:
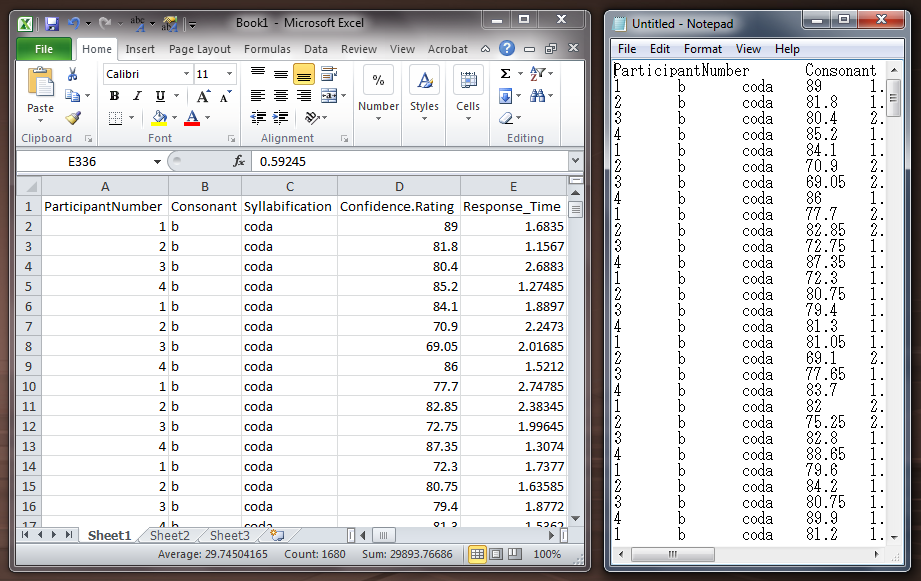
By default, it will put a tab between neighboring cells in a row, and put different rows onto different lines. Now save the textfile on your computer in a place you'll remember.
This method is recommended because it gives you full control of what data you are placing in the textfile. There is also a second option that is slightly simpler but requires your data to be stored in a single contiguous range at the top-left corner of one of the sheets in your Excel workbook (and that all other cells in that sheet must be empty). If this is the case, you can go to "File > Save As" and select "Text (Tab delimited)" or "CSV (Comma delimited)". (See here for a walkthrough with screenshots.) If your Excel workbook contains multiple sheets/tabs, it will only save the active sheet (i.e. the one that was visible when you hit "File > Save As"). Hit "OK" to Excel's warning that features such as text formatting will not be preserved.
Now you're ready to rock and roll! Let's get to importing this into R!
This is the script you will need to import this data textfile into R. Click on this link and follow the instructions inside. Once you're done, you will have an object inside R called a 'dataframe' that you can then take and run through whatever statistical-test script you like.
Since this is the first script you're running, there are a few important pointers you should keep in mind over the process of running this and all following scripts:
Once you've walked through the "import dataframe" script above, should be ready to go! Go ahead and proceed to the script below for the specific analysis you are interested in.
For your convenience, here is the script to import your data textfile as a dataframe, repeated from above
And here is a zip file with all of the script files zipped-up. The zip file also includes this set of sample data ('X-lang_Regression').
Histograms:
Barplots:
Boxplots:
Scatterplots:
t-tests:
Analysis of variance (ANOVA):
Multiple analysis of variance (MANOVA):
Correlation and linear regression:
Logistic regression:
Scripts that let you specify your own formula for added flexibility:
[ Return to the homepage of the Indiana University Phonetics Lab ]
Copyright (C) 2012-2014 Aaron Albin. The code here is released under the GNU General Public License as follows:
This program is free software: you can redistribute it and/or modify it under the terms of the GNU General Public License as published by the Free Software Foundation, either version 3 of the License, or (at your option) any later version. This program is distributed in the hope that it will be useful, but WITHOUT ANY WARRANTY; without even the implied warranty of MERCHANTABILITY or FITNESS FOR A PARTICULAR PURPOSE. See the GNU General Public License for more details. You should have received a copy of the GNU General Public License along with this program. If not, see http://www.gnu.org/licenses/.
If you have any questions, comments, or suggestions, feel free to send me an e-mail at aaalbin [AT] indiana [DOT] edu. I'd love to hear your input!