[Index | 1 | 2 | 3 | 4 | 5 | 6 | 7 | 8 | 9 |10]
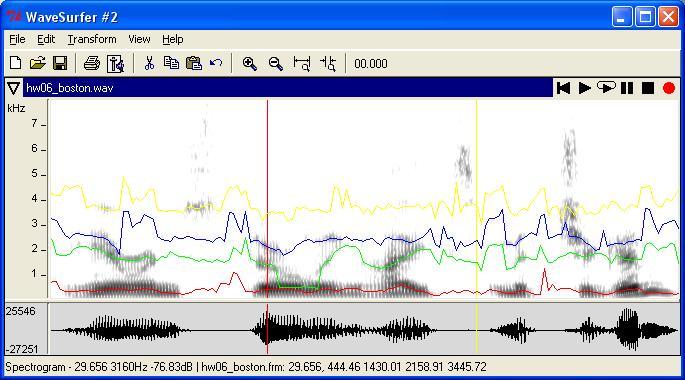
Preparation: Use the sound file hw06_boston.wav for your practice. Open the file with the waveform cofiguration. Select and zoom-in the part of "here in Sterling Heights, Michigan". Create a Formant Plot pane.
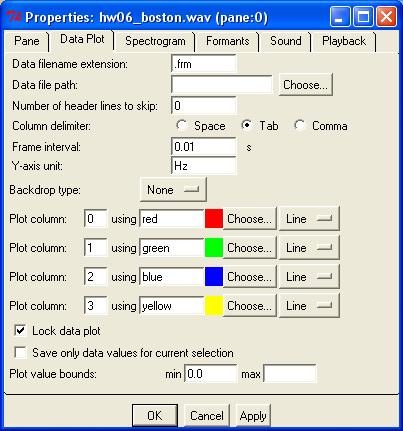
Lock data plot
When you drag the cursor, the tracked formant lines are modified. To avoid this function, you need to lock the data plot.
Properties of Formants
In order to measure formant values as accurately as possible, you can change several parameters in the Properties of Formants plot (Right-click on the formant plot and select properties).
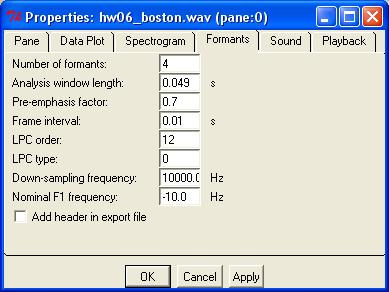
Parameters of Formants Properties
Number of formants: Use 3 or 2. default = 4.
Analysis window length: Use default value.
Pre-emphasis factor: Use a value between 0 and .99 (Recommended value are between 0.96 and 0.99)
Frame interval: Use default value for vowel analysis.
LPC order: Use values between 8 and 20. In general, use a higher number for male, a smaller number for female.
LPC type: I can't figure out this parameter. Use default value (=0).
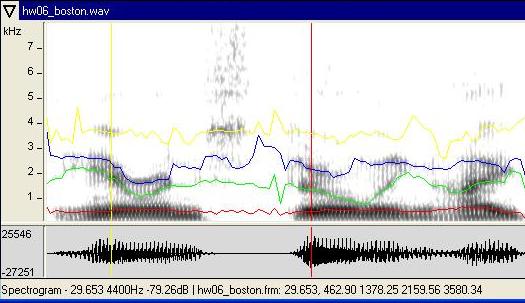
In the top figure, pre-emphasis factor was 0.7, LPC order was 12. Below is the formant analysis with pre-emphasis factor =0.96 and LPC order =20. You will see that the formant values are nicely tracked with the new parameter setting.
If you repeatedly do same analysis of formants, you can save your properties.
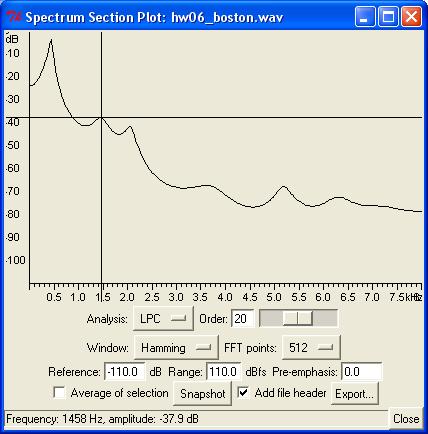
Formant plot requires computation of the whole sound. Spectrum analysis is a quick way to check the formant values for a specific point or a selected portion. Peak values in the Spectrum Section Plot corresponds to formant values.
Prepared by Kyoko Nagao
Last updated on Feb 29, 2004