[Index | 1 | 2 | 3 | 4 | 5 | 6 | 7 | 8 | 9 |10]
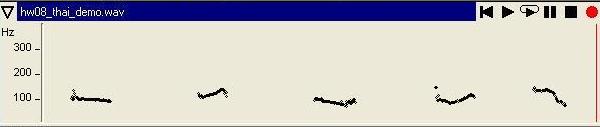
Preparation: Use the sound file hw08_thai_demo.wav for your practice. Open the file with the Waveform cofiguration. Create a Pitch Contour pane.
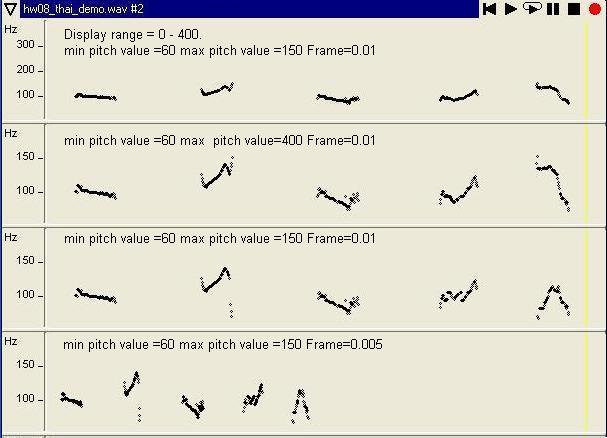
NOTE: Examples show only the pitch contour plot.
From the pitch contour above, can you tell the sex of this speaker?
Average range of fundamental frequencies are:
| Male | 120 Hz |
| Female | 220 Hz |
| Children | 270-550 Hz |
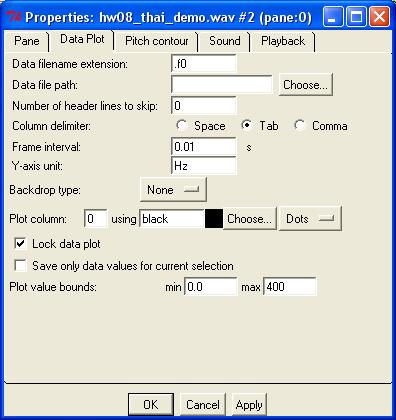
Now take a look at some properties of the pitch contour plot. Right click on the pitch plot and select Properties...:
In the Data Plot tab, you can change the parameters for F0 plot display and the parameters for data saving.
Change Plot value bounds to suitable values. In this example, min=50 and max=200. (Unit is Hz.)
Check the Lock data plot button.
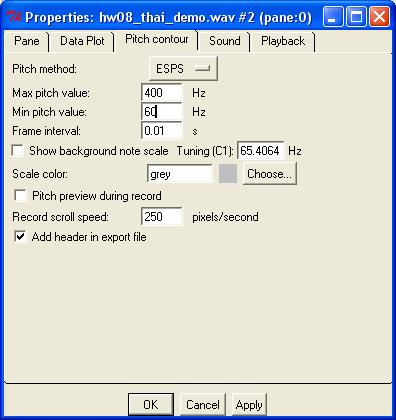
Click the Pitch contour tab. The parameters in the Pitch contour tab are used for estimating F0 values.
Pitch method: Select ESPS
Max and Min pitch values: Adjust suitable values for a speaker. In this exercise, use min=60 Hz and max=150 Hz.
Frame interval: 0.01 s (See below).
Changing parameters of Pitch contour will produce a different F0 plot.
ESPS method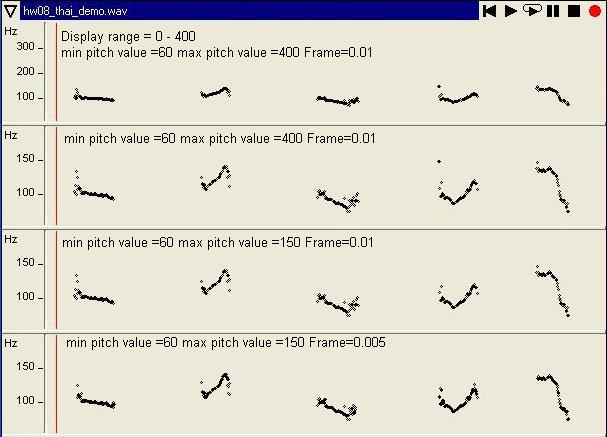
AMDF method
Prepared by Kyoko Nagao
Last updated on Mar 11, 2004